Public Health Practicum: Health Literacy and Its Connection to Health Equity: The Role of Infographics
Organization: SCHEQ Foundation - STEMM & Cancer Health Equity
Preceptor: Eugene Manley Jr. PhD
Program Advisor: Marie Sillice, PhD
Deliverable 2: Literature Review
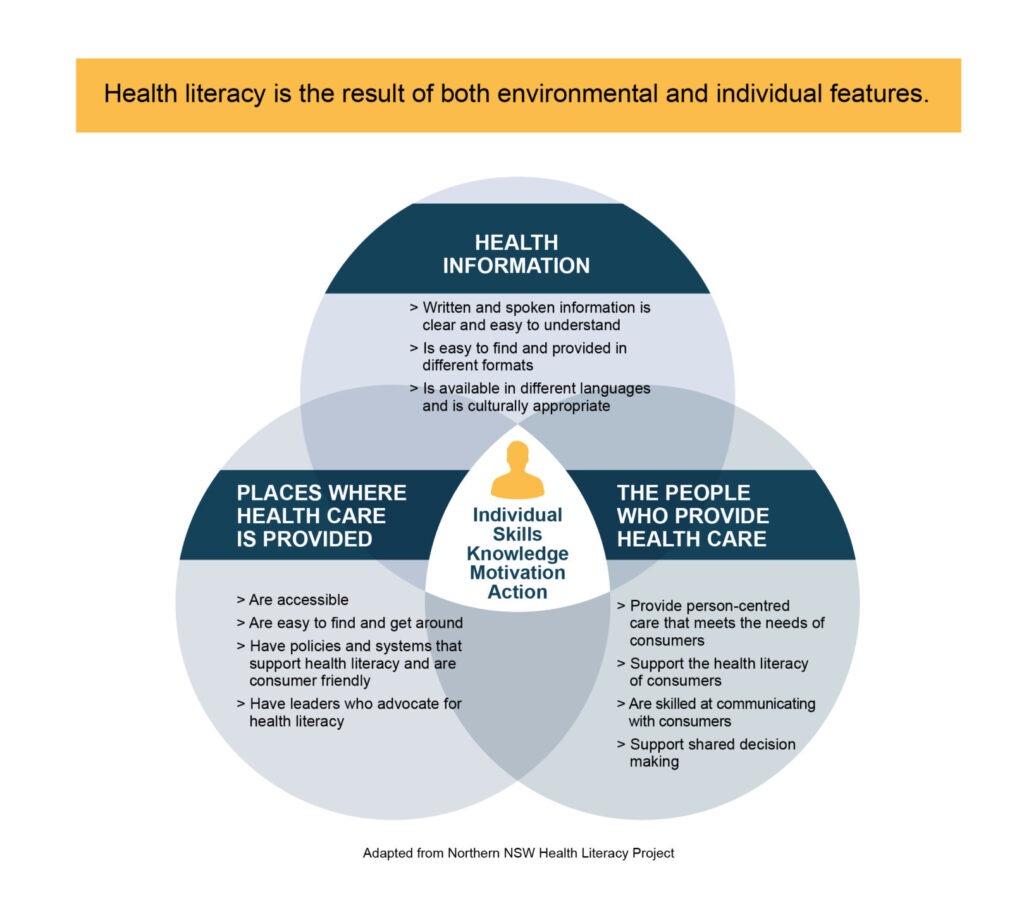
Health literacy is defined as “the degree to which individuals have the ability to find, understand, and use health knowledge to inform health-related decisions” (Healthy People 2030, n.d.). It encompasses not just an understanding of basic medical vocabulary but also the skills required to comprehend health instructions from a provider, ask personally relevant questions, and seek out additional information from reputable sources (Centers for Disease Control, [CDC], 2024). Understanding one’s health is essential for maintaining wellness through preventive care and becomes even more salient when one falls ill. In short, health literacy is shown to be necessary in navigating the healthcare system and increasing patient outcomes. People have varying levels of health literacy, however, it is essential to note that it is not a static attribute but a malleable skill set that can improve over time (El-Toukhy, 2018). Attaining health literacy is not just the responsibility of individual patients but is a goal that the healthcare system strives toward health equity. For instance, health literacy is prioritized by the US Department of Health and Human Services across many of its agencies, including the Centers for Medicare & Medicaid Services and the Centers for Disease Control and Prevention (Center for Health Care Strategies, 2024). The Healthy People 2030 initiative describes health literacy as an essential approach toward eliminat[ing] health disparities, achiev[ing] health equity, and [thus] … improving the health and well-being of all” (Healthy People 2030, n.d.). Though it is recognized that health literacy is essential in the progress toward health equity, there are still critical gaps in people’s ability to understand and use health information. Health infographics are one promising tool that can be employed to address disparities in health literacy.
The Health Literacy Crisis
An alarmingly limited portion of the US population is considered fully health literate. Both objective data and personal assessments indicate that there is a health literacy crisis in the US. Studies estimate that between one-third and one-half of US citizens have low health literacy, defined as a limited capacity to understand the basic health information necessary to make informed decisions (Schillinger, 2021). Even more alarming is that 9 out of 10 US adults agree they cannot fully understand and employ health information (CDC, 2024). The cause of this crisis is multifactorial and complex; there are challenges in obtaining health information, barriers to understanding health information, and challenges using that information (Egbert & Nanna, 2009). Healthcare providers are most often the primary source of health information, but many are unable to devote the time to educate their patients adequately. Physician surveys reveal that they are frequently forced to sacrifice patient education to contend with the high volume of appointments they must hold (Nguyen et al., 2024). Research also demonstrates that doctors often make “instantaneous, subconscious, and inaccurate judgments about what their patients can understand” and misjudge the health literacy of up to 40% of patients (Kelly & Haidet, 2007). Most of the time, doctors overestimate patients’ understanding, which means they are not tailoring their education and instruction to meet patients’ needs (Kelly & Haidet, 2007). Furthermore, patients often have difficulty acquiring accurate health information from other sources to compensate for the lack of understanding they get through interactions with their healthcare providers. Health information online tends to be overly complex, and social media makes it easy to find health information from less reliable and often untrustworthy sources (Nutbeam & Lloyd, 2021). These barriers demonstrate how it is challenging to become health literate in the complex healthcare system in the US.
Consequences of Low Health Literacy
A lack of health literacy is costly for patients and the healthcare system—both in terms of financial and human impact. An estimated $25 to $100 billion could be saved annually in the US if low health literacy was adequately addressed (Mantwill et al., 2015). This tremendous cost is a consequence of hundreds of thousands of preventable emergency visits and hospitalizations (CDC, 2024). Data supports that people with low health literacy are more likely to experience a variety of poor health outcomes; Schillinger (2021) synthesizes this body of research in his review of social determinants, disparities, and health literacy. For instance, those with low health literacy have higher rates of chronic disease, make more medication dosing errors, have less interactive visits with their doctors, and are less likely to engage in the medical decision-making process (Schillinger, 2021). Low health literate patients are less likely to receive preventive care and more likely to visit emergency rooms frequently, which is a pattern indicative of having a high degree of unmet health needs (Schillinger, 2021). These trends in health outcomes result in individuals with low health literacy having nearly two times higher mortality rates compared to those who are health literate (Schillinger, 2021). The overwhelming evidence demonstrates that low health literacy is detrimental for patients, which makes it a social determinant of health and a target to improve health equity (Nutbeam & Lloyd, 2021).
Disparities in Health Literacy
Although a lack of health literacy affects people across all sociodemographic groups, it does not affect all populations equally. Those who are white, middle-class, and English-speaking tend to have the highest levels of health literacy (Center for Health Care Strategies, 2024). On the other hand, low health literacy disproportionately affects vulnerable groups, including those of low socioeconomic status, people identifying as racial/ethnic minorities, and people with limited education or limited English proficiency (Schillinger, 2021). Limited English proficiency is a particularly salient characteristic predicting low health literacy; while 13.8% of native English speakers have low health literacy, 44.9% of those with limited English proficiency do (Sentell & Braun, 2012). Besides language, the most substantial contributors to disparities in health literacy are income and education, with smaller contributions by race and ethnicity variables (Fleary & Ettienne, 2019; Chaudry et al., 2012). It is also vital to consider how people at the intersection of these identities are particularly vulnerable to low health literacy. The populations most affected by the health literacy crisis are those affected by various other health inequities (Ndugga et al., 2024). Recent research now focuses on how health literacy may mediate the relationships between other social determinants of health and health outcomes, but further study is necessary (Schillinger, 2021). Additional research in the global context will be essential in confirming that health literacy follows a “social gradient” (Mantwill et al., 2015).
It is clear that the health literacy crisis is a crucial factor perpetuating health inequities (Center for Health Care Strategies, 2024). Because the disproportionate distribution of low health literacy interplays with other demographic factors to lead to health disparities, improving health literacy is a potential strategy to work towards health equity. Notably, health literacy is malleable, meaning interventions can improve health literacy skills (Schillinger, 2021). Everyone, from healthcare providers to educators, government agencies, and political leaders, has a stake in promoting health literacy, especially in communities impacted most.
Infographics and Health Literacy
Health literacy is a key target for advancing health equity and ensuring everyone has a fair opportunity to be healthy. Health literacy has been employed as a tool to empower and enable people to achieve optimal health (Fleary & Ettienne, 2019). There are many strategies for improving health literacy, such as enhancing people’s general health literacy skills through education and making health information more patient-friendly. While improving health literacy should be addressed in the education system, this approach can take years to have an effect. Working towards health literacy by making health information more accessible can be more quickly implemented and helpful for patients in the near future. One promising avenue to improve health literacy in this way is through the use of infographics.
Infographics combine text with visual representations of concepts or data to effectively communicate health information (CDC, 2024). All infographics contain some text but place emphasis on conveying information through images and diagrams. This makes them a promising strategy for reaching those with low health literacy, poor general literacy, and non-English speakers. Attention-grabbing, visually appealing, and concise infographics offer the most significant advantage over conveying health information in plain text (Singh, 2021).
Research demonstrates that infographics can improve patients’ understanding of health information among the general population. For instance, a recent randomized controlled trial found that interventions using infographics significantly enhance health literacy for patients with various diseases, including type 2 diabetes, heart failure, asthma, fibromyalgia, dementia, and HIV (Sutthiworapon et al., 2024; Chen et al., 2011; Arcia et al., 2019; Millar et al., 2024). Furthermore, this increase in health literacy has been directly linked to improved health outcomes. For instance, a project using HIV-related health infographics in the Dominican Republic effectively increased the knowledge of individuals with low health literacy and improved health outcomes, including a lower HIV viral load (Stonbraker et al., 2022).
There is limited research on the utility of infographics in specific vulnerable populations with low health literacy and how they may be helpful in ameliorating health disparities. General guidance on tailoring infographics to specific groups highlights the importance of using a culturally sensitive approach (Taye et al., 2024). Two studies have found that infographics helped communicate health information to Hispanic/Latinx groups with low health literacy. One demonstrated that involving community members in designing COVID-19-related infographics was crucial to their success among Spanish-speaking communities; more than simply translating existing infographics was needed (Aya Pastrana et al., 2023). The other study found that infographics aided in successfully communicating Community Based Participatory Research (CBPR) findings to Hispanic/Latinx farmworkers (Quandt et al., 2023). Though further research is necessary, infographics are a strong potential strategy for increasing health literacy among populations disproportionately impacted by health disparities and the health literacy crisis (Fleary & Ettienne, 2019).
Intended Impact of the General Health Infographics
The collection of infographics I developed for SCHEQ is intended to help address the health literacy crisis by making easily understandable health information more accessible to patients. I focused on explaining general health terms using visual elements and a 6th- 8th-grade reading level so that the infographics would be helpful for all patients, even those with low health literacy. The General Health Infographics are intended to increase readers’ health vocabulary and serve as a basis to further their health learning. SCHEQ will share these resources as they see fit, such as by making them available on their website. The infographics are intended to reach members of communities that have been historically neglected by the healthcare system and provide health education materials accessible to everyone. I hope the infographics prove to be a valuable resource for individual patients seeking to better understand their health. I also hope that the knowledge people gain from the General Health Infographics will empower them to better navigate the complex healthcare system in this country and progress towards their optimal state of health. Although this project will by no means be a panacea for the health literacy crisis, I hope that it will have a meaningful impact on members of our communities.
I envision that this project will serve as a basis for SCHEQ to expand its work targeting health literacy improvement to progress toward the foundation’s mission of advancing health equity. This may be accomplished by building upon the limitations of this project. First, future students can create new infographics to expand the collection. Many of the current infographic terms center around conveying an understanding of clinical trials, and only a few explain common health conditions. I think that it would be helpful to expand upon this work by incorporating more infographics covering common chronic health conditions that disparately affect those with low health literacy. These could include, but are not limited to, “Heart Disease,” “Chronic Obstructive Pulmonary Disease,” “Peripheral Arterial Disease,” “Cirrhosis,” and “Chronic Kidney Disease.” Another category of infographic topics could be to expand on the common medical tests for which I gave a brief overview in two infographics. Separate infographics could be devoted to fully explaining these tests and what their results mean. Finally, to complement SCHEQ’s cancer-related infographics, another group of infographics could specifically cover common cancer treatments and their side effects, such as chemotherapy, radiation, and surgeries.
My additional recommendations for using the General Health Infographics to further health equity are based on the US Center for Health Care Strategies’ universal health literacy precautions. They advise testing infographics and eliciting feedback from the audience, translating them into other languages, and making them accessible to everyone regardless of one’s use of assistive technology (Center for Health Care Strategies, 2024). For instance, the infographics could be piloted with their intended audience and revised based on their feedback. SCHEQ could hold focus groups to allow the intended audience to discuss what works well with the infographics and what could be improved upon. Additionally, the infographics could be translated into other languages, such as Spanish, to enable those with low English proficiency to better benefit from the infographics. This could be accomplished using professional translation services and engaging with community members on how to modify the infographics specifically for their groups. Finally, SCHEQ could explore making print and digital formats of the infographics accessible to people who use assistive technology. This might include converting them to audio formats.
References
Aya Pastrana, N., Agudelo-Londoño, S., Franco-Suarez, O., Otero Machuca, J., Guzman-Tordecilla, D. N., López Sánchez, M. C., Rodriguez-Patarroyo, M., Rivera-Sánchez, C. A., Castro-Barbudo, D., Trujillo, A. J., Maniar, V., & Vecino-Ortiz, A. I. (2023). Improving COVID-19 vaccine uptake: a message co-design process for a national health intervention in Colombia. Global Health Action, 16(1), 2242670. https://doi.org/10.1080/165497...
Arcia, A., Suero-Tejeda, N., Spiegel-Gotsch, N., Luchsinger, J. A., Mittelman, M., & Bakken, S. (2019). Helping Hispanic family caregivers of persons with dementia “get the picture” about health status through tailored infographics. The Gerontologist, 59(5), e479–e489. https://doi.org/10.1093/geront/gnz085
Chaudhry, S. I., Herrin, J., Phillips, C., Butler, J., Mukerjhee, S., Murillo, J., Onwuanyi, A., Seto, T. B., Spertus, J., & Krumholz, H. M. (2011). Racial disparities in health literacy and access to care among patients with heart failure. Journal of Cardiac Failure, 17(2), 122–127. https://doi.org/10.1016/j.cardfail.2010.09.016
Chen, A. M. H., Yehle, K. S., Plake, K. S., Murawski, M. M., & Mason, H. L. (2011). Health literacy and self-care of patients with heart failure. The Journal of Cardiovascular Nursing, 26(6), 446–451. https://doi.org/10.1097/JCN.0b013e31820598d4
Centers for Disease Control and Prevention [CDC.] (2024, March 27). Health Literacy: Accurate, Accessible and Actionable Health Information for All. Centers for Disease Control and Prevention. https://www.cdc.gov/healthliteracy/index.html
Darcy, R. (2022). Infographics, assessment and digital literacy: innovating learning and teaching through developing ethically responsible digital competencies in public health. ASCILITE Publications, 112–120. https://doi.org/10.14742/apubs.2019.182
Egbert, N., & Nanna, K. (2009). Health literacy: Challenges and strategies. Online Journal of Issues in Nursing, 14(3). https://doi.org/10.3912/ojin.vol14no03man01
El-Toukhy, S. (2018). Office of Minority Health. US Department of Health and Human Services.
Fleary, S. A., & Ettienne, R. (2019). Social Disparities in Health Literacy in the United States. Health Literacy Research and Practice, 3(1), e47–e52. https://doi.org/10.3928/24748307-20190131-01
Health Resources and Services Administration. (n.d.). Addressing health literacy Retrieved September 2, 2024, from https://www.hrsa.gov/about/organization/bureaus/ohe/health-literacy
Healthy People 2030. (n.d.). Health Literacy in Healthy People 2030. Retrieved September 2, 2024, from https://health.gov/healthypeople/priority-areas/health-literacy-healthy-people-2030
Center for Health Care Strategies. (2024). How improving health literacy can advance health equity. https://www.chcs.org/resource/how-improving-health-literacy-can-advance-health-equity/
Kelly, P. A., & Haidet, P. (2007). Physician overestimation of patient literacy: a potential source of health care disparities. Patient Education and Counseling, 66(1), 119–122. https://doi.org/10.1016/j.pec.2006.10.007
Mantwill, S., Monestel-Umaña, S., & Schulz, P. J. (2015). The relationship between health literacy and health disparities: A systematic review. PloS One, 10(12), e0145455. https://doi.org/10.1371/journal.pone.0145455
Millar, K. A., Crump, L., & LaChapelle, D. L. (2024). Lived experiences of cognitive dysfunction in fibromyalgia: How patients discuss their experiences and suggestions for patient education. Journal of Patient Experience, 11, 23743735241229384. https://doi.org/10.1177/23743735241229385
Ndugga, N., Pillai, D., & Artiga, S. (2024, August 14). Disparities in health and health care: 5 key questions and answers. KFF. https://www.kff.org/racial-equity-and-health-policy/issue-brief/disparities-in-health-and-health-care-5-key-question-and-answers/
Nguyen, M.-L. T., Honcharov, V., Ballard, D., Satterwhite, S., McDermott, A. M., & Sarkar, U. (2024). Primary care physicians’ experiences with and adaptations to time constraints. JAMA Network Open, 7(4), e248827. https://doi.org/10.1001/jamanetworkopen.2024.8827
Nutbeam, D., & Lloyd, J. E. (2021). Understanding and Responding to Health Literacy as a Social Determinant of Health. Annual Review of Public Health, 42, 159–173. https://doi.org/10.1146/annurev-publhealth-090419-102529
Quandt, S. A., Younger, E. C., Arnold, T. J., Zepeda, R., Arcury, T. A., & Daniel, S. S. (2023). Developing infographics to present research findings from CBPR to Latinx farmworker community members. Progress in Community Health Partnerships: Research, Education, and Action, 17(2), 217–225. https://doi.org/10.1353/cpr.2023.a900202
Schillinger, D. (2021). Social determinants, health literacy, and disparities: Intersections and controversies. Health Literacy Research and Practice, 5(3), e234–e243. https://doi.org/10.3928/24748307-20210712-01
Sentell, T., & Braun, K. L. (2012). Low health literacy, limited English proficiency, and health status in Asians, Latinos, and other racial/ethnic groups in California. Journal of Health Communication, 17 Suppl 3(sup3), 82–99. https://doi.org/10.1080/10810730.2012.712621
Stonbraker, S., Flynn, G., George, M., Cunto-Amesty, S., Alcántara, C., Abraído-Lanza, A. F., Halpern, M., Rowell-Cunsolo, T., Bakken, S., & Schnall, R. (2022). Feasibility and acceptability of using information visualizations to improve HIV-related communication in a limited-resource setting: a short report. AIDS Care, 34(4), 535–541. https://doi.org/10.1080/09540121.2021.1883517
Sutthiworapon, S., Vichitkunakorn, P., Choomalee, K., & Ngamchaliew, P. (2024). Effect of online infographics for enhancing health literacy among patients with type 2 diabetes in primary care unit during the COVID-19 pandemic: a randomized controlled trial. BMC Primary Care, 25(1), 87. https://doi.org/10.1186/s12875-024-02335-2
Taye, R., Paswan, A., & Deori, K. (2024). Effectiveness of cultural sensitivity on public health infographics in diverse population. SSRN Electronic Journal. https://doi.org/10.2139/ssrn.5015994
Final Report
Introduction
Health Literacy
Health literacy, or the lack thereof, is a pressing public health issue (Health literacy in Healthy People 2030, n.d.). As defined by the Healthy People 2030 initiative, healthy literacy is “the degree to which individuals have the ability to find, understand, and use health knowledge to inform health-related decisions” (Health Communication, n.d.). A person who has attained personal health literacy is not only able to comprehend verbal or written instructions given by a doctor but can also seek out additional information from reputable sources (Health literacy in Healthy People 2030, n.d.). Simply put, health literacy is necessary to navigate and use the healthcare system. Understanding one’s health is essential for maintaining wellness and becomes even more salient when one falls ill. A basic health vocabulary is necessary to understand one’s health conditions, how they may impact them, and what they can do to achieve optimal health (Centers for Disease Control [CDC], 2024).
However, many individuals fall short of attaining health literacy in the complex health system of the United States. Data shows that almost 9 out of 10 US adults agree they cannot fully understand and employ health information (CDC, 2024). The causes contributing to the health literacy crisis include challenges related to obtaining health information, understanding health information, and using information (Egbert & Nanna, 2009). Doctors are a major source of health information for patients, but these providers often cannot devote time to educating their patients adequately. Surveys of physicians reveal that many often sacrifice aspects of patient care, including patient education, to contend with the high volume of patients (Nguyen et al., 2024). Patients may have difficulty acquiring accurate health information from sources other than their doctors. Health information available online tends to be overly complex, and social media makes it easy to find health information from less reliable and often untrustworthy sources (Nutbeam & Lloyd, 2021).
The lack of health literacy has significant effects on the healthcare system, making it more challenging to navigate and more costly in terms of money and human impact. The CDC estimates that improving health literacy could prevent hundreds of thousands of hospitalizations and save over $25 billion annually in the US (CDC, 2024). People who lack health literacy make more medication dosing errors, visit the emergency room more often, and miss out on preventative services (Addressing health literacy, n.d.). Health literacy is linked to health outcomes, making it a social determinant of health and a target to improve health equity (Nutbeam & Lloyd, 2021). Health illiteracy disproportionately affects disadvantaged groups to a greater degree than those who are white, middle-class, and English-speaking. Income and education are the strongest contributors to disparities in health literacy, and race and age also significantly contribute (Fleary & Ettienne, 2019). These factors do not operate independently; rather, they interact to impact health literacy. The disproportionate spread of the lack of health literacy compounds existing health disparities, making improving health literacy an essential target to further health equity. Everyone, from healthcare providers to educators, government agencies, and communities, has a stake in promoting health literacy, particularly in communities impacted the most.
Infographics combine text with visual representations of concepts or data. Infographics are an effective method of communicating health information (CDC, 2024). All infographics contain some text but focus on conveying information through images and diagrams, making them an essential strategy for reaching those with low health literacy, poor general literacy, and non-English speakers. Attention-grabbing, visually appealing, and concise infographics offer the most significant advantage over conveying health information in plain text (Singh, 2021). Another potential advantage of using infographics for health communications is that they are accessible online and more easily distributed electronically, which widens the audience they reach (Darcy, 2022). Among the general population, infographics have been demonstrated to affect patients’ understanding of health information. For instance, a recent randomized controlled trial found that infographics can significantly enhance health literacy among patients with type 2 diabetes (Sutthiworapon et al., 2024). Infographics have been successfully employed to enhance health literacy among patients in several recent studies with diseases including fibromyalgia, dementia, and HIV (Arcia et al., 2019; Millar et al., 2024). Furthermore, HIV-related health infographics employed in the Dominican Republic were shown to be effective in educating individuals with low health literacy (Stonbraker et al., 2022). Finally, not only have infographics been shown to be effective in increasing an individual’s health literacy, but they have also been associated with improved health outcomes, such as lower HIV viral load (Stonbraker et al., 2022). Accordingly, infographics have the potential to increase health literacy among populations that have shown an inadequate understanding of health-related information.
This Practicum attempts to ameliorate the health literacy crisis by making general health information more accessible via infographics. In partnership with SCHEQ, I will develop infographics that will be accessible to the foundation’s diverse patient population of individuals of different races, cultures, ages, socioeconomic statuses, education levels, health issues, and needs.
Goals and Objectives
The first goal is to increase general health literacy among populations with low health literacy, including those from underserved and marginalized groups who are diagnosed with cancer. This corresponds to the first process objective: "Over the course of one semester, create 27 general health infographics, including visual representations and written content (at no greater than a 6th to 8th-grade reading level) on health topics for the SCHEQ patient resources page.”
The second goal of this practicum is to understand and emphasize the importance of health literacy and the role that infographics may play in striving for health equity. This maps to the second process objective: “Over the duration of one semester, compile a 3–6-page written report including a literature review of how health illiteracy exacerbates health disparities, an argument for the need to expand health literacy, and the intended impact of this collection of infographics.
Methods
Deliverable 1: General Health Infographics
I developed a collection of 27 general health infographics, each centering around a specific term or topic related to health. These infographics were designed to present information quickly and clearly to patients with low health literacy. I prioritized content clarity over complexity and used visuals to break down more challenging concepts. I used Canva, an online graphic design tool, to create the infographics. I started by generating a template in Canva using the SCHEQ brand guide (Appendix 1). I made copies of this template for each infographic and labeled them accordingly.
To make the infographics, I first gathered information and data for each term. I supplemented my understanding of the health-related terms as a medical student with research from several sources. I used the PubMed database to find peer-reviewed literature and UpToDate to clarify my understanding of disease-related topics. I also relied heavily on material from the National Institutes of Health, the Centers for Disease Control, and the World Health Organization websites for content and inspiration. I created a basic structured outline of the content I wanted to include for each infographic. I spent time deciding which information was essential and should be prioritized. I focused on what I wanted my audience to understand, how I wanted my audience to feel, and what I wanted my audience to do with the information I was presenting. I narrowed my topics to three to five main ideas per infographic. Using this framework, I was able to distill the key messages from my source material intended for academic audiences and translate this information into a more basic language accessible to the public. My sources were cited as appropriate, and I included links to them in the infographic so readers can obtain further information.
I employed the GRAPHIC technique when turning my basic outline into drafts of the infographics. GRAPHIC is a commonly used acronym for the used in public health infographic design: Get to know your audience; Restrict color; Align elements; Prioritize parts; Highlight the heading; Invest in imagery; and Choose charts carefully (The 7 Graphic Principles of Public Health Infographic Design (n.d.)). I used the CDC step-by-step guidelines for developing infographics based on these GRAPHIC principles. I started by understanding my audience, which was a general audience of patients. However, I kept in mind that this includes those who have been marginalized and disadvantaged in the medical system and those with low health literacy. To ensure that everyone, regardless of education level, could utilize the infographics, I used no greater than a 6-8th grade reading level in all text. I accomplished this by avoiding complex language in favor of more straightforward words, keeping sentences and paragraphs short, and avoiding jargon. I also placed an emphasis on the visual elements conveying concepts.
I then created a heading to capture the audience’s attention and serve as a starting point for reading the infographics. From this heading, I established a visual hierarchy that uses colors, font sizes, and spatial arrangements to create order and direct the reading through the infographic from top to bottom. I often used arrows to direct the reader through the infographic. I also created visual focal points around the elements of the graphics that supported the key messages. I did this using colors with sharp contrast to ensure that all text was viewable. I used an easily legible font in various sizes to emphasize certain parts of the graphic. The smallest size font I used was 16. I included images when I felt they served a purpose to illustrate content or to engage and better connect with the audience. I adhered to the CDC graph recommendations when I generated elements for data visualization. These guidelines included bar graphs to show frequency or to compare groups, pie charts to communicate proportion, picture and icon tables as an alternative way of conveying frequency, line graphs for illustrating trends over time, and maps to display spatial or geographic data. Once I completed a draft of an infographic, I used a Flesch-Kincaid Grade Level test, a validated and widely used measure for readability, to make an objective determination of the readability of my infographic content. The infographics were all written in English.
After designing each infographic, I went through a process of revision to ensure that each message was conveyed completely and appropriately. I first revised the infographics on my own. Next, I periodically met with Dr. Manley and Dr. Sillice over Zoom to discuss my most recent infographics. We had four such meetings in total. During these meetings, we went through each infographic together to find what was working well and what could be improved upon, both in terms of content and graphic design. I kept a detailed record of all suggested changes, and after each meeting, I revised each infographic by incorporating the proposed changes into the design. Finally, I formatted my infographics after the content for each was finalized. This involved making sure they were neat, centered, and symmetrical using the ruler tool in Canva.
My goal for deliverable 1 was to increase general health literacy among populations with low health literacy, including those from underserved and marginalized groups who are diagnosed with cancer. This mapped to my first process objective: over the course of one semester, create 2 general health infographics, including visual representations and written content (at no greater than a 6th to 8th-grade reading level) on health topics for the SCHEQ patient resources page.
Deliverable 2: Report
I created a 6-page report for the board of SCHEQ as my second deliverable to accompany the collection of infographics. I first developed an outline of my report based on the requirements set forth by Dr. Manley. My report describes the state of health literacy in the US and defines it as a public health crisis. I emphasized the importance of health literacy and how a lack of health literacy leads to poorer health outcomes. I then described disparities in health literacy and how this exacerbates existing health outcome disparities. Next, I explained how infographics can be used as a tool to increase health literacy among populations with low health literacy. I framed infographics as a strategy for furthering health equity.
To create this report, I first conducted a literature review to draw from the existing body of research on health literacy and disparities. The primary questions I sought to answer in this literature review were “How does health literacy, or lack thereof, contribute to health inequity,” “How does a lack of health literacy exacerbate existing health disparities,” and “How can health literacy be promoted to increase health equity?” I again used the PubMed database to find relevant literature. My search terms included but were not limited to “health literacy and health equity,” “health literacy and health disparities,” “health literacy and underserved populations,” “health infographics,” “health literacy intervention,” and “health education intervention.” I included peer-reviewed research conducted in the past twenty years, focusing on the most recent studies. I prioritized studies that employ sound methodology and statistical analyses to control for confounders. Next, I incorporated the information from my literature review into my outline. I then drafted my report and personally revised it. I also met with Dr. Manley and Dr. Sillice to discuss potential changes to the report and revised it as needed. This component of the practicum was completed in Microsoft Word.
This deliverable was aligned with my second goal to understand and emphasize the importance of health literacy and the role that infographics may play in striving for health equity. This goal corresponded to my second process objective: over the duration of one semester, compile a 3–6-page written report including a literature review of how health illiteracy exacerbates health disparities, an argument for the need to expand health literacy, and the intended impact of this collection of infographics.
Resources Used
- 1. Canva subscription $120/year (already purchased for another project)
- 2. SCHEQ Branding Guide
- 3. Stony Brook University Health Sciences Library Databases
- 4. Microsoft Word
Results
Deliverable 1: Infographics
I created 27 infographics in total. Each infographic took approximately 3-4 hours to draft and another hour to edit and format. All infographics are located in Appendix 2.
The terms for the infographics I created are:
- 1. Hazard Ratio
- 2. Effect Size (in clinical trials)
- 3. ICD Codes
- 4. Blood Pressure
- 5. Hypertension
- 6. Clinical Trials
- 7. Phase I Clinical Trial
- 8. Phase II Clinical Trial
- 9. Phase III Clinical Trial
- 10. Phase IV Clinical Trial
- 11. Pharmacokinetics and Pharmacodynamics
- 12. Efficacy vs. Effectiveness
- 13. HIPAA
- 14. Informed Consent in Research
- 15. Informed Consent in Treatment
- 16. Sensitivity vs Specificity
- 17. Statistical Significance
- 18. Social Determinants of Health
- 19. Health Equity
- 20. Diagnostic Imaging (CT, MRI, Ultrasound, etc.)
- 21. Diagnostic Lab Tests (CBC, CMP, thyroid function)
- 22. Primary, Secondary, and Tertiary Prevention
- 23. Standard Deviation
- 24. Placebo Effect
- 25. Type 2 Diabetes Mellitus
- 26. Reading Scientific Studies
- 27. Correlation vs. Causation
Deliverable 2: Report
I wrote a 5-page, single-spaced report about health literacy and its connection to health equity. This included a literature review on health literacy, disparities in health literacy, and the role of infographics in promoting health equity. The report took approximately ten hours to compose and edit. It is included in Appendix 3.
Discussion
The collection of infographics I developed for SCHEQ is intended to help address the health literacy crisis by making health information more accessible to patients. I focused on explaining general health terms using visual elements and a 6th- 8th-grade reading level so that the infographics could be helpful to all patients, especially those with low health literacy. The General Health Infographics are intended to increase readers’ health vocabulary and serve as a basis for learning more about their health. SCHEQ will share these resources as they see fit, such as by making them available on their website for patients to access. Our intention is that the infographics will reach members of communities that have been historically neglected by the healthcare system. I also hope that the knowledge people gain from the General Health Infographics will empower them to better navigate the complex healthcare system in this country and progress towards their optimal state of health. Although this project will by no means be a panacea for the health literacy crisis, I hope that it will have a meaningful impact on members of our communities.
One of the major limitations of this Practicum is that neither a needs assessment nor a program evaluation was performed. A needs assessment of the target audience would have been helpful to conduct before the infographics in order to inform their development. For instance, interviews with members of communities historically marginalized in healthcare who have lower health literacy would better inform the development of infographics intended for that population. Additionally, engaging the intended targets of a communication intervention in the evaluation of the infographics enables one to ensure that their needs are being met. Although a needs assessment and an evaluation were not within the scope of this project, they could be considered in the future.
I envision that this project will serve as a basis for SCHEQ to expand its work targeting health literacy improvement to progress toward the foundation’s mission of advancing health equity. There are several ways in which I think SCHEQ can further the General Health Infographics project by building upon this work in the future. First, new infographics can be added to expand the collection. A significant number of the terms I included were focused on helping the general public understand clinical trials. I think it would be helpful to expand upon this collection by incorporating more infographics covering common chronic health conditions that disparately affect those with low health literacy. These could include, but are not limited to, “Cardiovascular Disease,” “Chronic Obstructive Pulmonary Disease,” “Peripheral Arterial Disease,” “Cirrhosis,” and “Chronic Kidney Disease.”
My additional recommendations for using the General Health Infographics to further health equity are based on the US Center for Health Care Strategies' universal health literacy precautions. They recommend testing infographics and eliciting feedback from the audience, translating them into other languages, and making them accessible to everyone regardless of one’s use of assistive technology (Center for Health Care Strategies, 2024). For instance, the infographics could be piloted with their intended audience and revised based on their feedback. SCHEQ could hold focus groups to allow the intended audience to discuss what works well with the infographics and what could be improved upon. Additionally, the infographics could be translated into other languages, such as Spanish, to enable those with low English proficiency to better benefit from the infographics. This could be accomplished using professional translation services and engaging with community members on how to modify the infographics specifically for their groups. Finally, SCHEQ could explore making print and digital formats of the infographics accessible to people who use assistive technology. This might include converting them into audio formats.
Post a comment